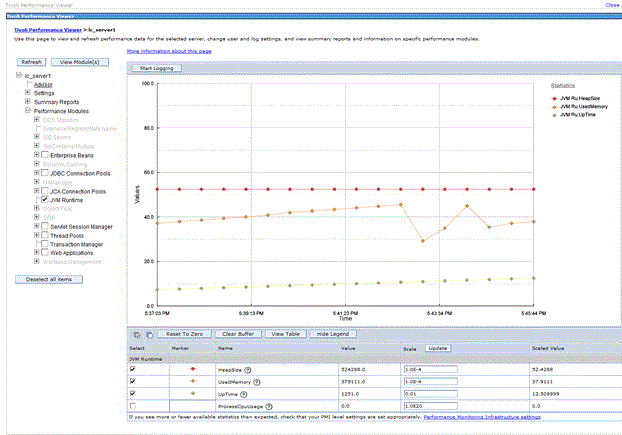
Monitoring PMI data with Tivoli Performance Viewer
Recently I got opportunity to use Tivoli Performance Viewer (TPV) for monitoring application server counters of Java base web application which was deployed on Websphere Application Server. Below are the guidelines for how to use TPV to view Performance Monitoring Infrastructure (PMI) data in chart or table form.
Basic:
TPV monitors the performance activity of all servers on a node. Before monitoring one should confirm that one or more servers have been created and are running on the node, and that PMI is enabled.
You view performance modules when your server is experiencing performance problems. For example, a common performance problem occurs when individual sessions are too large. To help view data on a session, you can view the Servlet Session Manager PMI module and monitor the SessionObjectSize counter to make sure that Session Object Size is not too large.
Performance modules are shown in the TPV current activity settings in the administrative console.

Procedure:
- Select PMI data to view.
- Click Monitoring and Tuning > Performance Viewer > Current Activity > server_name > Performance Modules (PM) in the console navigation tree.
- Place a check mark in the check box beside the name of each performance module that you want to view.
- Click on View Modules. A chart or table providing the requested data is displayed on the right side of the page. Charts are displayed by default.
If you do not see all the PMI counters you expect, or a PM you are interested in is visible but cannot be selected, PMI is not enabled for that particular counter or for any counter in that PM. Go to the PMI control area of the administrative console and enable PMI for any counters you wish to view, then return to TPV and select those PMs. To view the PMI page, click on Monitoring and Tuning > Performance Monitoring Infrastructure > server_name.
Some of the important counters you should monitor are given below:
| Category | Counter | Description |
| JDBC Connection Pools | CreateCount | The total number of connections that are created |
| CloseCount | The total number of connections that are closed | |
| PoolSize | The size of the connection pool. | |
| FreePoolSize | The number of free connections in the pool. | |
| WaitingThreadCount | The average number of threads that are concurrently waiting for connection. | |
| JVM Runtime | HeapSize | The Total memory (KiloBytes) in Java Virtual Machine Runtime |
| UsedMemory | The amount of Used Memory (KiloBytes) in Java Virtual Machine Runtime | |
| Thread Pools | Pool Size | Average number of thread in pool |
| Object Request Broker | Average number of thread in pool | |
| Message Listener | Average number of thread in pool | |
| WebContainer | Average number of thread in pool |
Each module has several counters associated with it. These counters are displayed in a table underneath the data chart or table. Selected counters are displayed in the chart or table. You can add or remove counters from the chart or table by selecting or deselecting individual counters. By default, the first three counters for each module are shown.
You can select up to 20 counters and display them in the TPV in the Current Activity mode. The data from all the PMI counters that are currently enabled in each PM for all active instances of the PM can be recorded and captured in a TPV log file. You can view the TPV log file for a particular time period multiple times, selecting different combinations of up to 20 counters each time. You have the flexibility to observe the relationships among different performance data in a server during a particular period of time.
- Optional: To remove a module from a chart or table, deselect the check box next to the module and click View Modules again.
- Optional: To view the data in a table, click View Table on the counter selection table. To toggle back to a chart, click View Graph.
- Optional: To view the legend for a chart, click Show Legend. To hide the legend, click Hide Legend.
- Scale the PMI data. You can manually adjust the scale for each counter so that the graph displays meaningful comparisons of different counters.
- Find the counter whose scale you want to modify in the table beneath the chart.
- Change the value for Scale as needed.
- Click Update.
- Clear values from tables and charts.
- Ensure that one or more modules are selected under Performance Modules in the TPV navigation tree
- Click Clear Buffer beneath the chart or table. The PMI data is removed from a table or chart.
- Reset counters to zero (0).
- Ensure that one or more modules are selected under Performance Modules in the TPV navigation tree
- Click Reset to Zero beneath the chart or table. Reset to Zero sets a new baseline using the current counter readings at the instant the button is clicked. Future data points are plotted on the graph relative to their position at the time Reset to Zero is clicked.